Score Contribution is a new GRESB feature that gives Real Estate Participants deeper insights into how individual assets contribute to their overall GRESB Score. It helps managers identify key areas for improvement and make data-driven decisions to enhance portfolio performance.
How it works
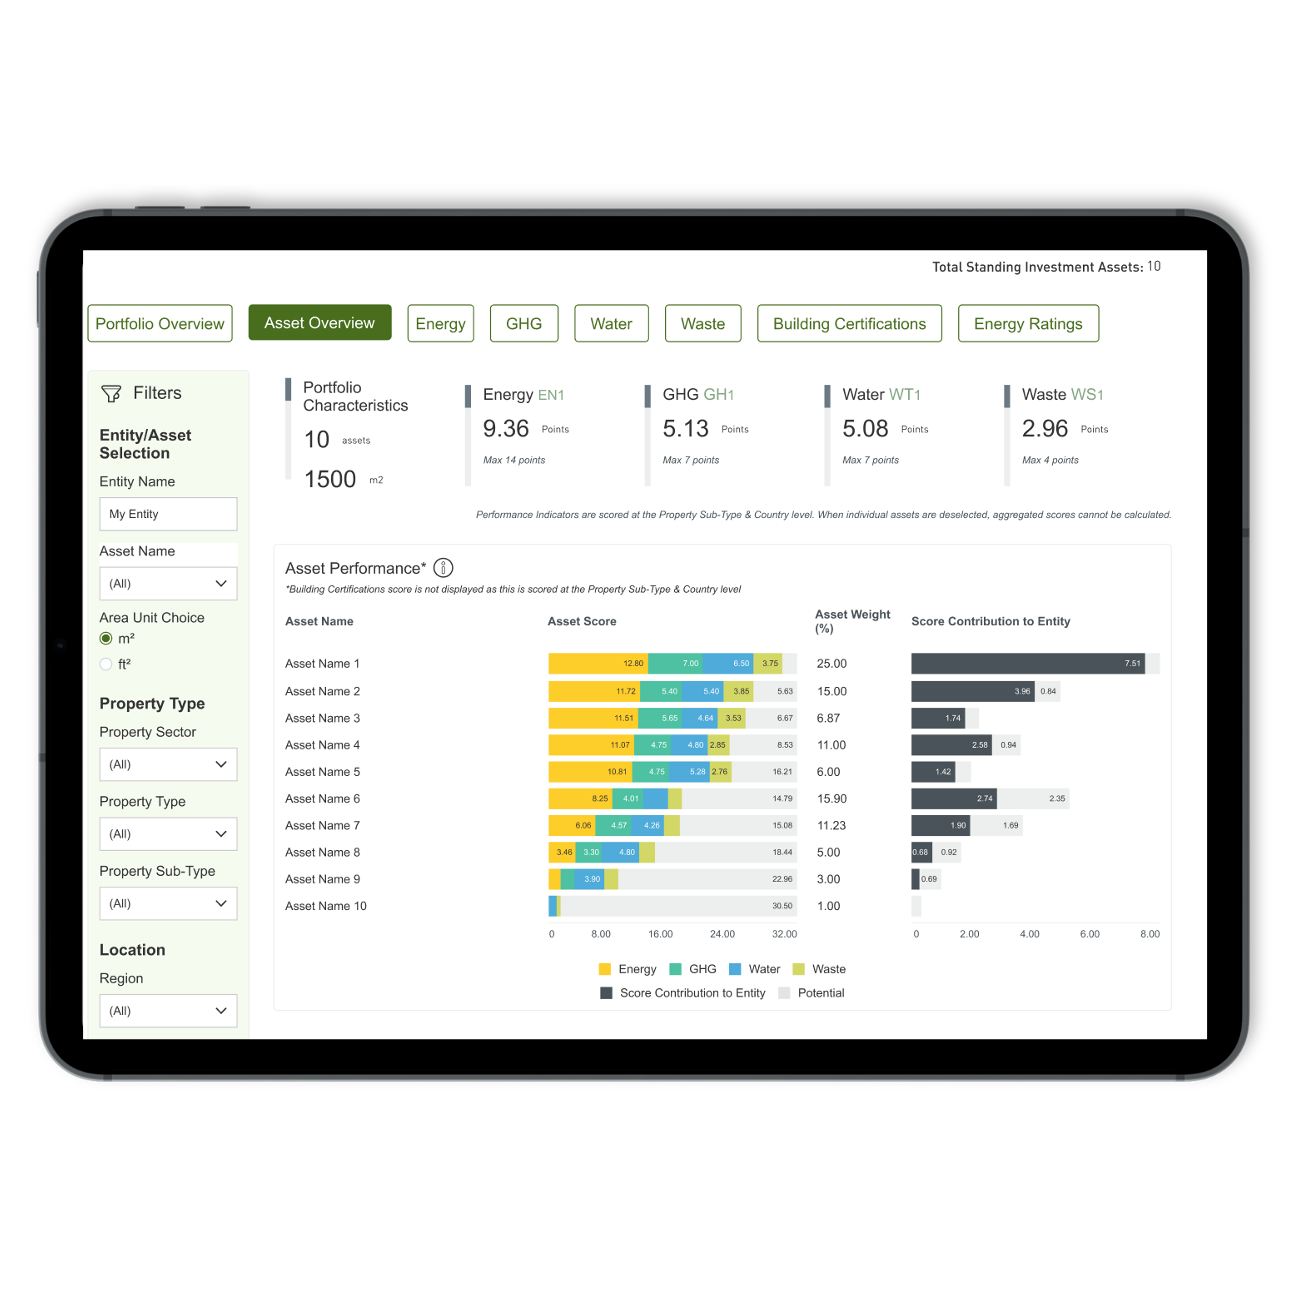
Score Contribution is available directly in the GRESB Portal for all Real Estate Participants. Users can use the private dashboard to track and explore assets at an aggregated level and across key performance metrics, to see which are helping or hurting their overall score.
- Asset-level insights: Understand how each asset impacts your portfolio’s overall score
- Targeted action: Identify the best opportunities to make performance improvements
- Enhanced stakeholder engagement: Use detailed scoring data to drive conversations with internal and external stakeholders
Get started
Real Estate Participants can now access the Score Contribution dashboard from the GRESB Portal.
Industry Perspective on Score Contribution
GRESB’s new Score Contribution tool is a very powerful and needed feature, that will help participants enhance their understanding of the asset-level contributions to a fund’s GRESB Score. By providing visibility into the various elements that influence fund performance, alongside each asset’s average contribution, it allows managers to better prioritize efforts, especially for large portfolios, and identify material opportunities for improvement—ultimately facilitating informed decision-making and meaningful actions.

Explore asset-level performance insights with REAL Benchmarks
Get deep, actionable insights into the energy and GHG performance of the individual assets in your real estate portfolio. Fill in data gaps with industry-leading estimations and benchmark assets against peers, decarbonization pathways, and your other assets.
Score Contribution FAQ
-
The Score Contribution dashboard is available to real estate entities completing the Performance Component of the GRESB Real Estate Assessment. Access to the dashboard is included in the GRESB membership and provides valuable insights into asset-level performance.
-
Users linked to the entity with the access rights of Account Manager, Internal Contributor, or Investor Relations Manager can see the Score Contribution dashboard.
-
No, access to the Score Contribution dashboard is private to the individual reporting entity and not available to investors.
-
Data and visuals from the Score Contribution dashboard can be exported in PDF, Excel, and PowerPoint formats. Use the Export buttons available in each tab of the dashboard.
-
The Asset Weight is an indication of the total contribution of each asset towards the overall portfolio score for a given metric. It is calculated by considering each asset’s floor area, percentage of ownership, as well as the percentage of GAV of the Property Sub-Type and Country the asset belongs to.
-
Asset Scores are determined for the Energy, GHG, Water, and Waste aspects of the GRESB Real Estate Assessment, with each metric calculated and scored at the asset level. For details on the scoring methodology, see the Scoring Document.
-
Score Contribution to Entity reflects how much each asset’s score contributes to the overall portfolio score. It is calculated by multiplying each Asset Score by the Asset Weight.
-
Potential indicates the remaining points each asset could achieve, highlighting opportunities for improvement. It is calculated as the difference between the maximum score available for a given indicator and the asset’s actual score.
-
The Score Contribution dashboard is updated annually in September and made available to participants during the Review Period.
-
The dashboard presents insights based on data submitted as part of the latest GRESB Real Estate Assessment. GRESB is exploring options to provide similar insights based on the live (non-submitted) data available in the Asset Portal.
-
The difference between the Score Contribution dashboard and the Benchmark Report lies in the level of granularity of the insights presented. The Score Contribution dashboard focuses on providing asset-level scoring insights, while the Benchmark Report presents GRESB results at the portfolio level. Both tools present insights based on the same underlying reported data and scoring methodology.
-
Score Contribution insights focus on how individual assets impact your overall portfolio’s GRESB Score, in the aggregate and across key performance metrics. In contrast, REAL Benchmarks insights help you understand how assets within your portfolio perform relative to industry peers, decarbonization pathways, and your other assets.
-
Score Contribution and REAL Benchmarks work together to provide a complete picture of your portfolio’s performance. While Score Contribution gives insights into how each asset within your own portfolio contributes to your GRESB Score, REAL Benchmarks offers a market-wide comparison, allowing you to assess how your portfolio measures up against peers and which of your assets are under- or overperforming. Using both tools enables more informed decision-making and targeted improvements.
Got any questions? Contact us
"*" indicates required fields