Users and Access Rights
Depending on the type of GRESB membership associated with your user account, the Portfolio Analysis Tool will give you access to the following entities:
- Participant Member: Access to your own entity or entities. You can find the overview of entities in your Assessment Portal.
- Investor Member with subscription to listed data: Access to all listed entities that have reported to GRESB (except entities under the Grace Period)
- Investor Member with subscription to non-listed data: Access to the entities where access has been granted by the Participant Member.
How to use the Portfolio Analysis Tool
-
Select the year you wish to analyze and click “Create a new [year] Real Estate analysis”. You can also access an existing analysis by clicking on its name.
Note that the GRESB Assessments always assess the ESG performance of reporting entities for the previous calendar/fiscal year. For example, the 2023 Real Estate Assessment assesses the ESG performance of reporting entities for calendar/fiscal year 2022.
First, define the scope of the analysis by selecting the Components submitted by the entity/entities.
There are two options:
- Management and Performance Components: The combination of these Components resulted in the participation in the Standing Investment Benchmark.
- Management and Development Components: The combination of these Components resulted in the participation in the Development Benchmark.
The content covered by each Component is explained in the 2023 Real Estate Reference Guide.
Entities that participated with a single Component are outside the scope of the Portfolio Analysis Tool as they have not received a GRESB Score.
-
Define the portfolio by selecting the entity or entities you wish to include in the analysis.
There are two ways to select entities:
- Manual selection: You can manually select entities from the list of all accessible entities. The search function or the “Filter” button can be used to narrow down the list of managers and participating entities. The “Filter” button allows sorting by:
- Location: GRESB assigns participating entities to a geographic category using a five-tier system: country, sub-region, region, super-region and global. The threshold for assigning a geographic category is set at 60 percent of the portfolio’s Gross Asset Value (GAV). The country, subregion, and region are defined using the UN country classification guidelines available here.
- Property type: Selecting a property type will include entities that have the selection as their predominant property type (75 percent or more).
- Legal status: Differentiate between listed and non-listed reporting entities. A listed entity refers to a company that is publicly listed and traded on a recognized stock exchange, such as Nasdaq or NYSE. A private entity is not listed or traded on any stock exchange.
- Investment strategy (only non-listed): Differentiate between Core, Value Added, and Opportunistic as investment strategies for non-listed entities.
For each filter category, it is possible to select multiple options. Once the filters are applied, the entities that should be included in the analysis can be selected from the list.
After selecting the entities, weights can be assigned. This will result in weighted average scores in the analysis of the aggregated portfolio.
- GAV weighted: each entity included in the analysis receives a weighting proportional to the Gross Asset Value (GAV) of its portfolio. Please note that for the entities selected, the percentage of ownership field will be pre-populated with 100 %. To change this, you can amend the value directly or use the below custom-weight option.
- Equally weighted: each entity included in the analysis receives the same weighting.
- Custom weighted: the user can manually amend the percentage values in the Weight column of the Portfolio selection. This allows users to input their percentage ownership of an entity.
For more details on aggregation logic, refer to Step 4 below.
Alternatively, you can use the “Import Entities” feature to assign custom Weights to the selected entities.
- Import Entities: Use the Import Entities button to open the import interface. This allows you to paste:
- The Fund ID of the entities you wish to include in the analysis;
- Percentage of ownership on each entity.
To do this, copy from an Excel file the Fund IDs (in column 1) and the attached percentage of ownership (column 2) on each entity to be included in the analysis. The Fund ID and the corresponding percentage of ownership of each entity should be pasted into the “paste columns here” textbox.
The weighting follows the same method as the above described Custom weighted approach.
Import Entities
How to find the Fund IDs?
The GRESB-specific Fund IDs can be found in the Data Exporter. The Data Exporter can be accessed via the GRESB Portal under the menu “Data Exports”. Any downloads from the Data Exporter have Fund ID as the third column.
It is always possible to clear selected entities using the “Clear Selection” button. You can ensure that the selection is effectively cleared by reviewing entities listed under “YOUR PORTFOLIO”.
-
Set the Benchmark criteria you are using for the analysis. To ensure a meaningful comparison, the Benchmark should contain a minimum of six constituents.
The Benchmark can be defined through filters. If no filters are applied, the selected Portfolio will be compared against the entire GRESB universe.
The available filters are:
- Location: See Step 2 above
- Property type: See Step 2 above
- Legal status / Investment strategy: See Step 2 above
- Entity: Users can manually select specific entities to be included in the Benchmark. This is only possible for entities you have access to (see User and access rights above). Note that if any entity is manually selected, other filters will be ignored.
- Size in GAV: Set boundaries for the Gross Asset Value of included entities.
For consistency purposes in the output, the weights allocated to the Benchmark automatically correspond to the weighting option selected for the Portfolio:
- Portfolio is Equally Weighted: Benchmark is Equally Weighted
- Portfolio is GAV Weighted: Benchmark is GAV Weighted
- Portfolio is either manually custom weighted or made use of Import Entities: Benchmark is GAV weighted
Once the Benchmark is defined, click NEXT STEP to access your analysis.
If you have any questions on how to interpret the results of your analysis, please feel free to contact us.
-
Analyze the performance of your Portfolio against the by you defined Benchmark.
Different weighting options have the following impact on the aggregation:
GAV weighted:
- Scores and other percentage metrics (e.g. Data Coverage, etc) are aggregated as the weighted average of the individual metrics of the Portfolio’s constituents, using their GAV as weighting factor.
- Absolute performance metrics (e.g. Energy Consumption, GHG Emissions, etc) are aggregated as the sum of all constituents in the Portfolio.
Equally weighted:
- This option only applies to Scores. Each entity’s score carries the same weight in the aggregated Portfolio Score. If this option is selected, the performance metrics of the analysis (i.e. the Portfolio Impact section) will not be displayed.
Custom weighted:
- The values of the percentage custom weights will be divided by the GAV of the respective entity (expressed in mUSD) in order to determine the Weight used in the aggregation of absolute performance metrics in the Portfolio Impact section, such as total energy consumption or total GHG emissions of the Portfolio. The scores and other performance metrics, such as data coverage, are aggregated using a weighted average of the assigned Weights.
-
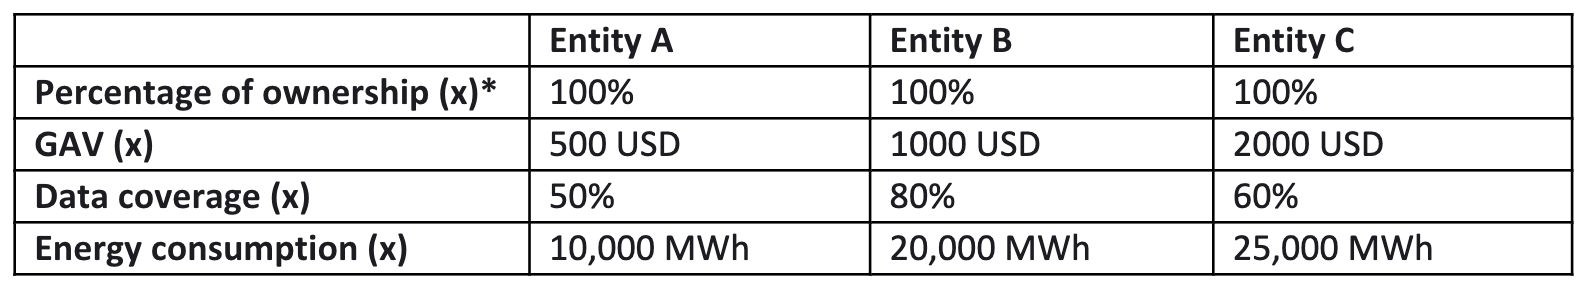
*% of ownership in a GAV weighted analysis is set to 100%.
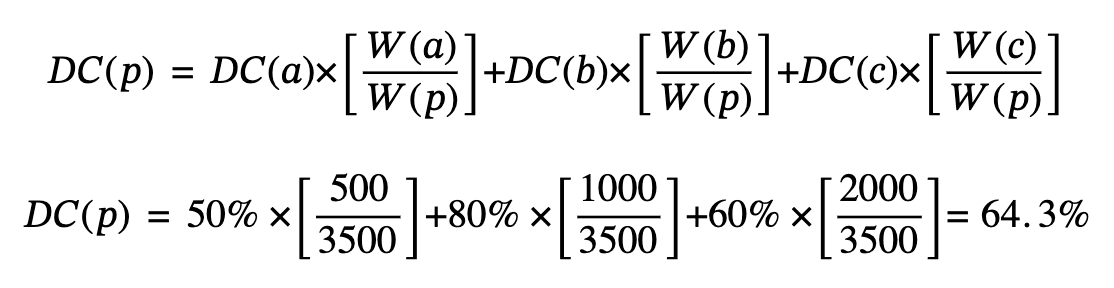
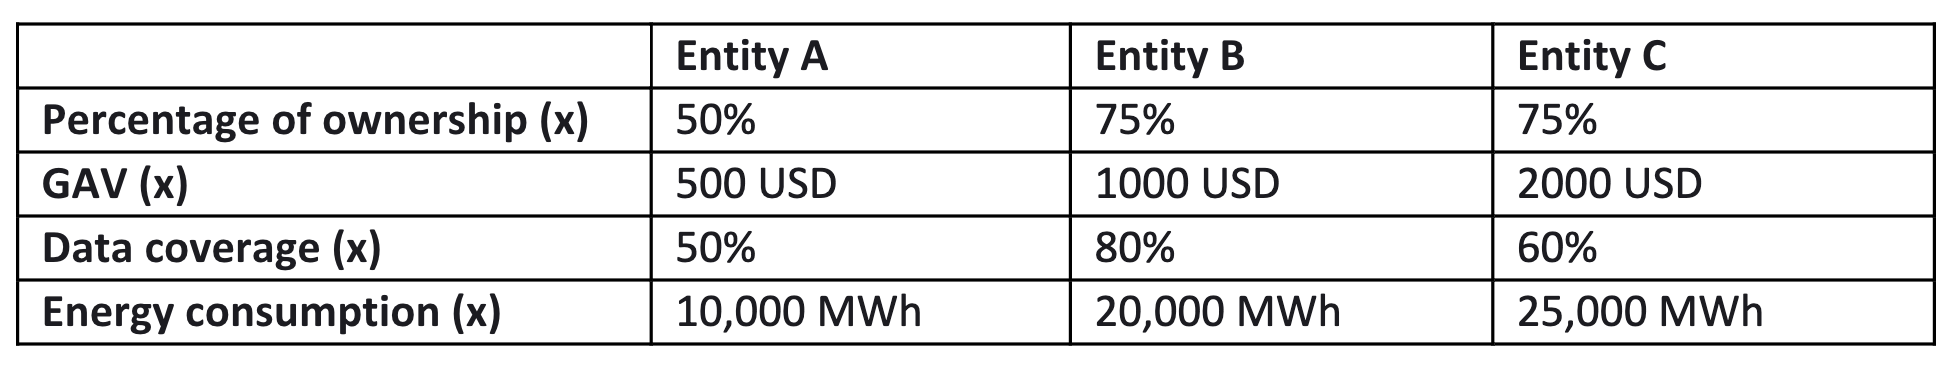
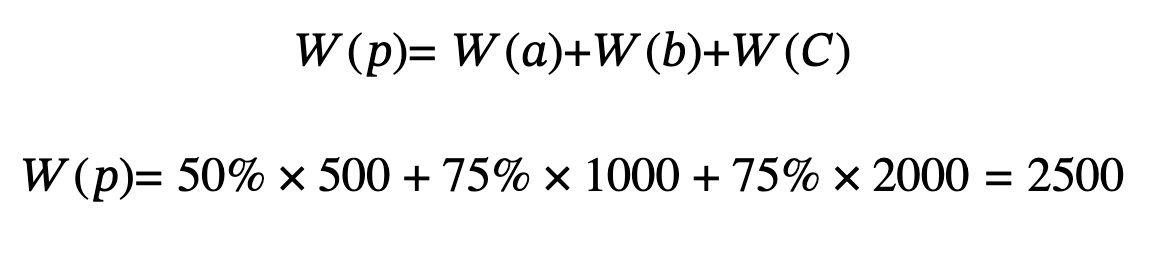
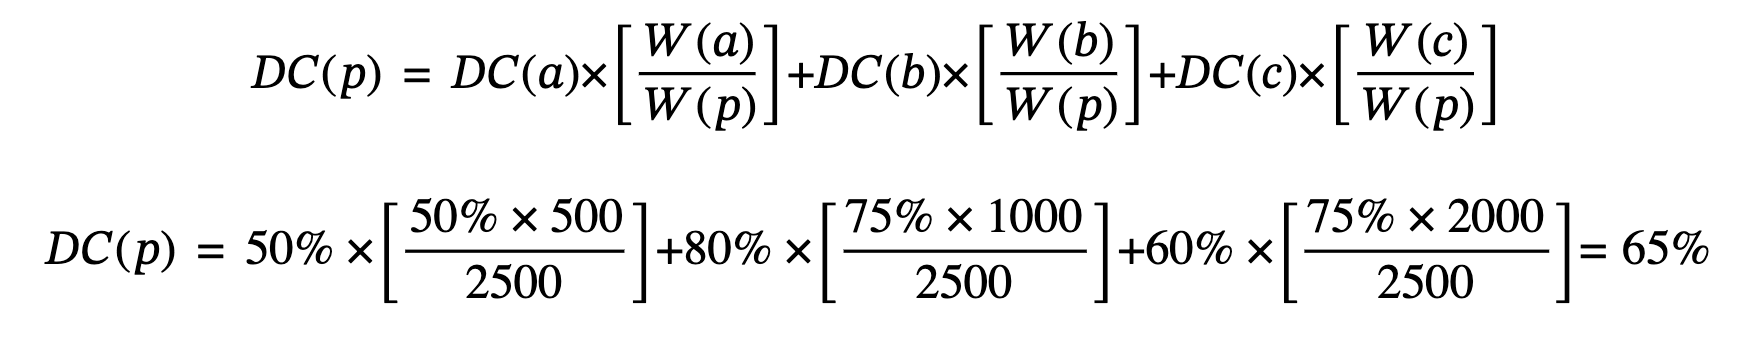
Data Coverage aggregation:
Consider Data Coverage(x) the Data Coverage of entity X, W(x) the weight allocated to entity X, and W(p) the total weight of the portfolio.
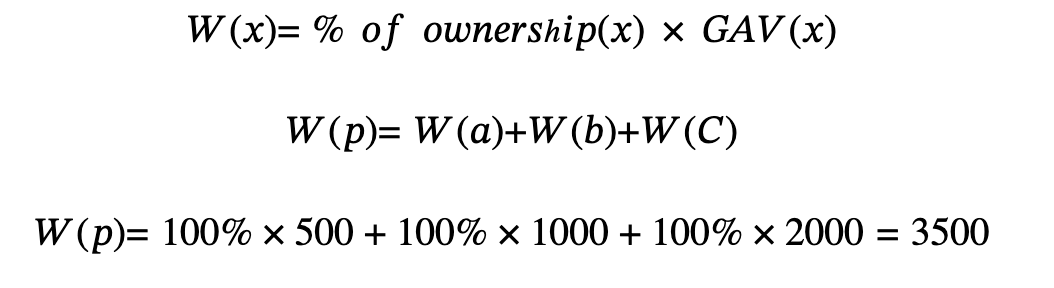
The total Data Coverage % of the portfolio is calculated as follows:
All scores and percentage metrics are aggregated as above.
Energy Consumption aggregation:
Consider E(x) the Energy Consumption of entity X and W(x) is the percentage of ownership on entity X.
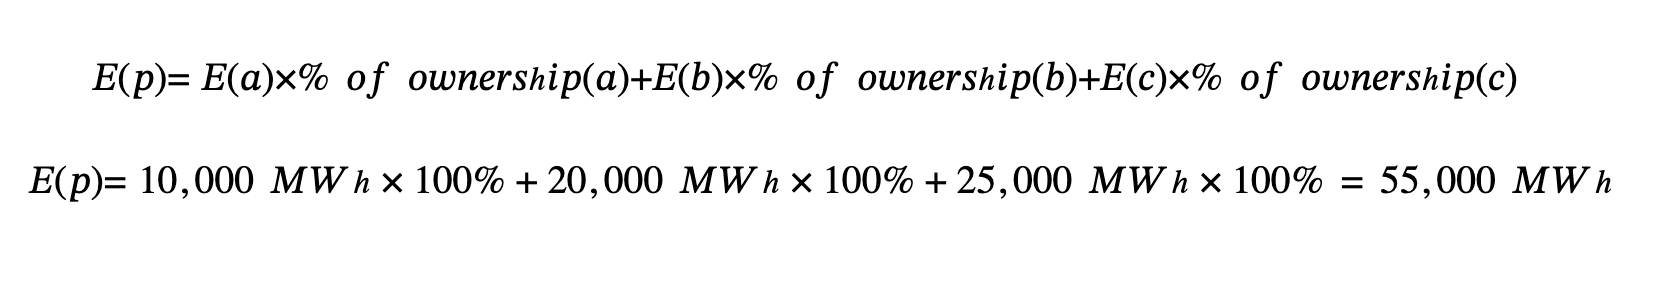
All absolute performance metrics are aggregated as above.
-
Data Coverage aggregation:
Consider Data Coverage(x) the Data Coverage of entity X, W(x) the weight allocated to entity X, and W(p) the total weight of the portfolio.
The total Data Coverage % of the portfolio is calculated as follows:
All scores and percentage metrics are aggregated as above.
Energy Consumption aggregation:
Consider E(x) the Energy Consumption of entity X and W(x) is the percentage of ownership on entity X.
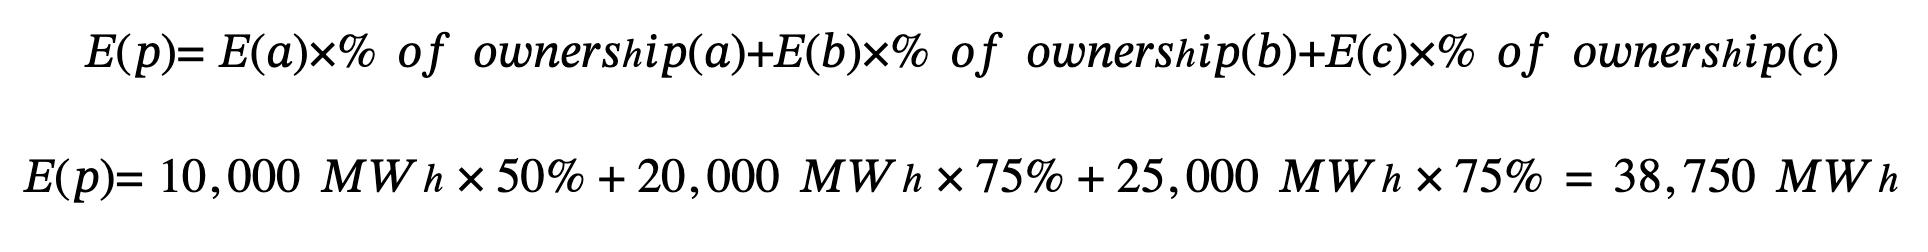
All absolute performance metrics are aggregated as above.