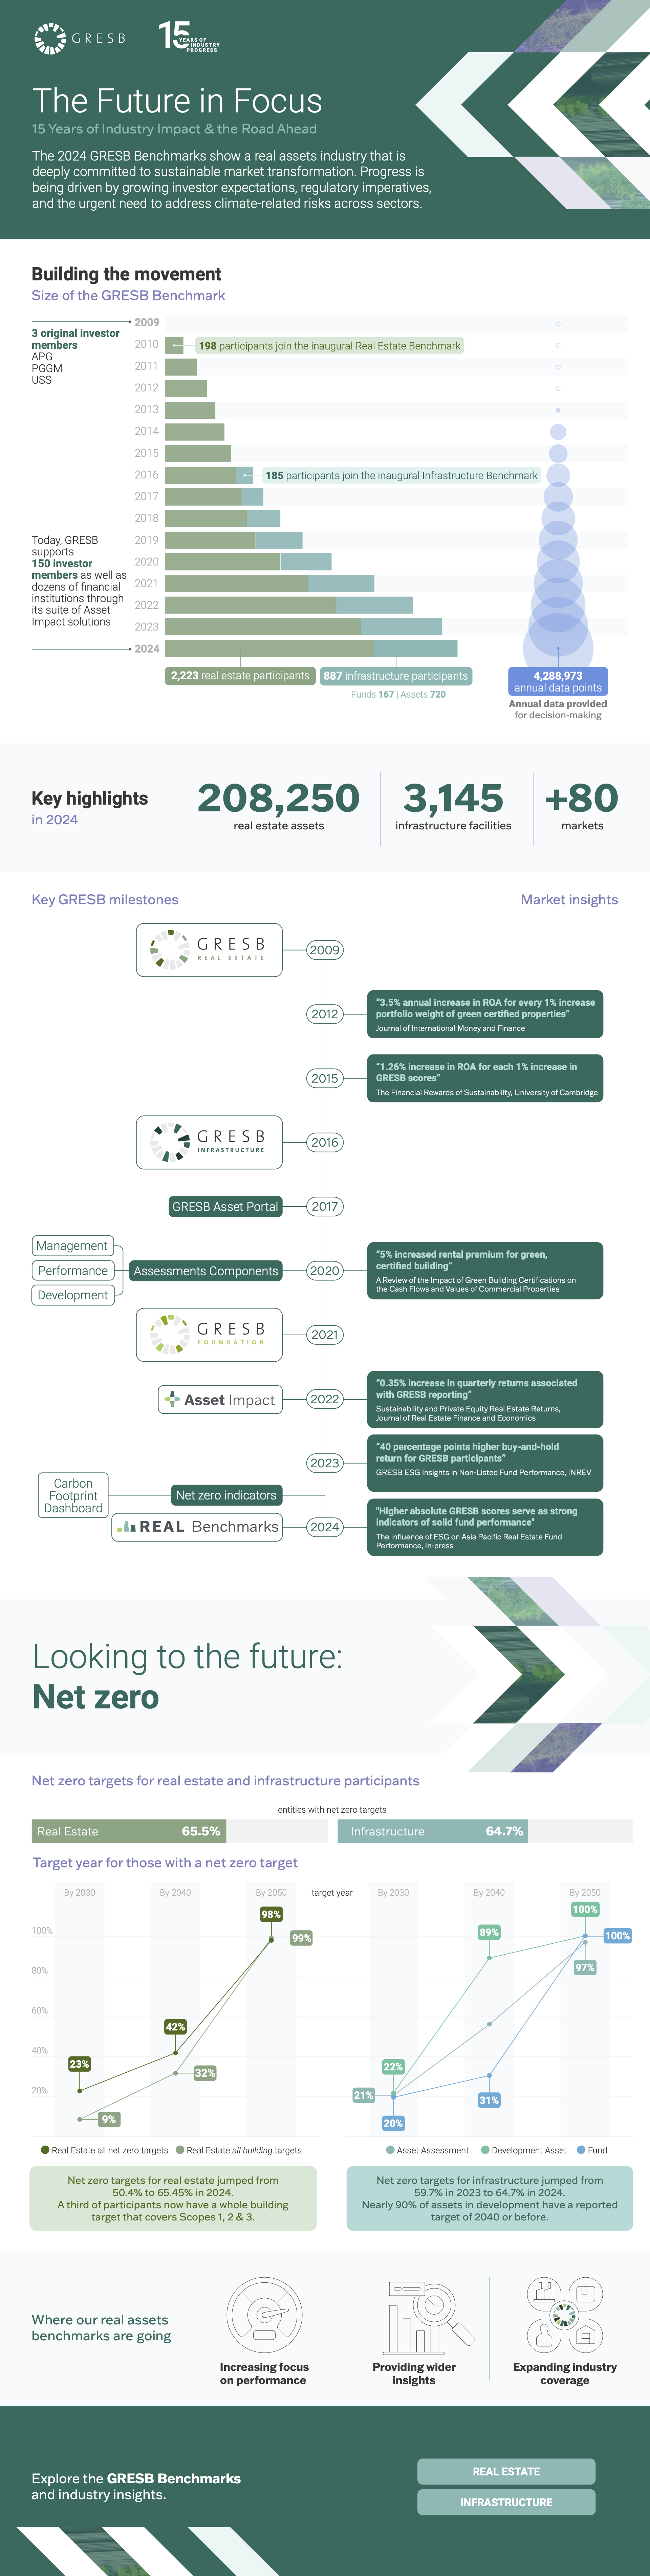


Coverage & Growth

Participation in the Fund Assessment up 10% in 2020
Despite the challenges posed by the Covid-19 crisis, the Infrastructure Fund Assessment grew to 75 funds completing both components – obtaining a GRESB Fund Score reflecting overall ESG performance at the portfolio level – and 118 completing the Management Component.
By region, Europe-focused funds are the largest contingent, followed by Globally Diversified.
The Assessment now covers 32% of IPE Real Assets’ Top 100 Infrastructure Investment Managers, and 38% of the Infrastructure Investor Top 50 – participating with at least one fund.

Participation in the Asset Assessment grew 8% in 2020
The Infrastructure Asset Assessment increased by 8% to cover 426 assets.
Assets based in Europe still make up the largest proportion but the main growth regions were Americas (from 88 to 105) and Asia (from 11 to 21). The Assessment now covers 32 of the 33 industry sectors, and 1,354 facilities across 59 countries.

Transport, Renewable Power and Social Infrastructure sectors have the highest representation
The growth in participation across sectors at the ‘superclass’ level is shown in the chart. Transport, Renewable Power and Social Infrastructure sectors have the highest representation. Data Infrastructure grew from 21 to 38 perhaps reflecting the importance of this sector during the Covid crisis. Energy and Water Resources also grew significantly while most other sectors were stable.

Overall Scores

Europe has the most funds and assets participating in the benchmark by value
Assets reported on six continents, with over 1,354 facilities (a 19% increase) spread across 59 countries, with coverage continuing to be dominated by OECD countries.
Europe builds upon its track record for transparency with the most funds and assets participating in the benchmark by value. Assets in Oceania, Americas and Asia scored similarly, while the European average was somewhat lower. This is likely due to the significant number of Social Infrastructure assets in Europe, which typically score lower than other sectors. Globally diversified assts scored highest on average, although the number of these is very small.

Leap in scores for both Funds and Assets
The big news this year is the leap in scores for both Funds and Assets. Overall GRESB Scores and Component Scores, saw increases ranging from 10 to 15 points on average. At a fund-level, only two funds saw their scores decrease whilst thirteen managed to score the maximum 100 for the Management Component showing further improvement on last year.
In the case of Assets, for the first time in GRESB history (including Real Estate), one asset scored a maximum 100 for their overall GRESB Score. This shows that the industry is maturing in its approach to ESG and is strongly focused on improving performance.
Fund Assessment Scores

Large increase in Fund Scores
The big rise in scores can be clearly seen in the GRESB Fund Model. This shows the Fund Management Score on the vertical axis and the Fund Performance Score on the horizontal axis.
Funds are eligible for the GRESB Fund Score when they report with more than 25% of their assets. These are represented by the blue dots. The average GRESB Fund Score increased to 65 points, from 55 in 2019.
Those reporting with less than 25% of their assets are represented by the grey dots. These receive a Fund Management Score and are clustered on the vertical axis.
Both Management and Performance Scores on average rose by 10 to 15 points. Fund GRESB Scores are starting to cluster in the top right

First-time fund participants enter the benchmark with average score of 59
This is an all time high for first-time participants.
The average GRESB Score of the 26 funds who have been consistently reporting for 5 years is 70 (58 in 2019).
GRESB is connecting funds and their managers at the beginning of their sustainability journey with a community of leaders, helping them to close the performance gap.
Asset Assessment Scores

Big jump in scores for Assets
The GRESB Model for Assets shows the score for each asset for the two Components (Management and Performance) that make up the overall GRESB Asset Score.
The big jump in scores for Assets is clearly evident. In past years, the GRESB Asset model used the dimensions of Management & Policy and Implementation and Measurement, which map only approximately to the current Management and Performance components, but still provide a useful trend comparison.

Network Utilities leads the pack
The best-scoring sector continues to be Network Utilities (with an average score of 73), closely followed by Power Generation x-Renewables (72) and Renewable Power (69).
While Social Infrastructure came in with the lowest average score again this year (47), it also posted one of the largest score increases (+18), narrowing the gap with other sectors.
The scores for the two energy generation sectors (Power Generation x-Renewables and Renewable Power) showed the biggest increases (+25 and +20 respectively).

Scores increase for almost all 15 sustainability Aspects
The GRESB Asset Assessment is structured now into 15 unique sustainability Aspects – five for the Management Component (right hand side of radar chart) and ten for the Performance Component (left hand side).
Aspect scores increased almost across the board. This shows that the increases in overall GRESB Score are driven by improvements across the Aspects, with the exception of certifications which remain a challenging Aspect to achieve a score.
Customer and Employee Satisfaction were newly scored indicators in 2020.

First-time participants score higher than ever
First-time participants enter the benchmark this year with an all-time high average score of 53. The average GRESB Score of the 62 assets who have been consistently reporting for 5 years is 75 (61 in 2019).
As with he Fund Assessment, GRESB is connecting assets and their managers at the beginning of their sustainability journey with a community of leaders, helping them to close the performance gap. First-time participants enter the benchmark this year with an all-time high average score: 53. The average GRESB Score of the 62 assets who have been consistently reporting for 5 years is 75 (61 in 2019).

Asset Performance Component indicators
Transparency on performance indicators has increased

The Asset Performance Component indicators show the extent to which assets report on their most material ESG issues. The chart focuses on the main ESG issues covered. The chart shows the proportion of participants that reported on each material indicator. Investor demand for greater reporting on these indicators has led to an increase in reporting for every issue except Health and Safety, which is stable compared to the previous year.
Target setting for 2019 has increased for all performance indicators

To drive performance improvement, it is good business practice to set targets and track performance. This chart shows the proportion of assets that set targets for the reporting year (2019). It is notable that target setting has increased for every ESG issue.
Target setting for future years has increased for all performance indicators
This chart shows the proportion of assets that set targets for future years. As with target setting for the reporting year, future year target setting has increased for every ESG issue, demonstrating how seriously ESG is now considered.

Resilience results are coming soon.

The ESG Public Disclosure dataset covers more than 200 listed infrastructure companies

Similarly to 2019, overall Europe has the most number of companies who scored a level of A. Relative to sample size Oceania is in the lead with with about 13% of entities scoring an A.
The dataset now covers more than 200 listed infrastructure companies and more than USD $2.5 trillion in market cap.
The data is also being used for a new GLIO/GRESB INDEX – the first specialist global listed infrastructure ESG focused index for global investors.

Recognizing leadership in the GRESB Infrastructure Assessment
Each year we are excited to recognize and celebrate GRESB Participants from across the world who have excelled with their leadership and commitment. For 2020, we announce the “GRESB Infrastructure Sector Leaders” who achieved the top scores in their category. This year we also introduce the “GRESB Infrastructure Most Improved” awards for funds and assets with the largest score increases. We congratulate these members and hope that their example will inspire the industry to further improvements.
2020 GRESB Infrastructure Sector Leaders
The GRESB Sector Leaders are the best performers by sector and region.
Entity Name | Fund Manager Name | Sector | Region |
---|---|---|
Arcus European Infrastructure Fund 1 | Arcus European Investment Manager LLP | Sector: Sectorally diversified |
Arcus Tivana Investor Vehicles | Arcus European Investment Manager LLP | Sector: Sector specific excluding Renewables |
Arcus Tivana Investor Vehicles | Arcus European Investment Manager LLP | Region: Europe |
Capital Dynamics Clean Energy and Infrastructure V JV LLC | Capital Dynamics | Sector: Renewable Power Generation |
Capital Dynamics Clean Energy and Infrastructure V JV LLC | Capital Dynamics | Region: Americas |
Macquarie Asia Infrastructure Fund 2 | Macquarie Infrastructure and Real Assets | Region: Asia and Oceania |
Vantage portfolio | Vantage Infrastructure | Region: Globally diversified |
Entity Name | Superclass | Class |
---|---|---|
Amey Belfast School Partnership PFI Co Limited | Social Infrastructure | Education Services |
Bayonne Energy Center | Power Generation x-Renewables | Independent Power Producers |
BlackRock - Gestión Integral de Hospitales de Zumpango, S.A.P.I. de C.V. ("GIHZ") | Social Infrastructure | Health and Social Care Services |
BUUK Infrastructure No 1 Limited | Diversified | |
Celeo Redes Brasil SA | Network Utilities | |
Crook Hill & Reaps Moss | Renewable Power | Wind Power Generation |
Glasgow Airport Limited | Transport | Airport Companies |
Globalvia | Transport | Road Companies |
ITS ConGlobal | Transport | |
MHL Supply Networks (Asia) Limited | Other | |
Oiltanking Singapore Chemical Storage Pte Ltd | Energy and Water Resources | |
OPALE DEFENSE | Social Infrastructure | Government Services |
Port of Brisbane Pty Ltd | Transport | Port Companies |
Saubermacher Dienstleistungs AG | Environmental Services | |
Sonnedix Power Holding | Renewable Power | Solar Power Generation |
South East Water | Network Utilities | Water and Sewerage Companies |
TDF | Data Infrastructure | Data Transmission |
UDICITE | Social Infrastructure | Education Services |
Ventient Energy | Renewable Power | Wind Power Generation |
Entity is an Asset Sector Leader (leader for the Class)
2020 GRESB Infrastructure Most Improved
GRESB Most Improved have the largest score increases compared to the previous year by sector and region.
Entity Name | Fund Manager Name | Sector | Region |
---|---|---|
Alinda Infrastructure Fund II | Alinda Capital Partners | Region: Globally diversified |
Civis PFI/PPP Infrastructure Fund LP | Dalmore Capital Limited | Sector: Sector specific |
Macquarie Asia Infrastructure Fund 2 | Macquarie Infrastructure and Real Assets | Sector: Sectorally diversified |
Macquarie Asia Infrastructure Fund 2 | Macquarie Infrastructure and Real Assets | Region: Other region (Americas, Asia or Oceania) |
Macquarie European Infrastructure Fund 4 | Macquarie Infrastructure and Real Assets | Region: Europe |
Entity Name | Superclass | Class |
---|---|---|
APRR | Transport | Road Companies |
Astoria Energy II | Power Generation x-Renewables | Independent Power Producers |
Aviva Investors Infrastructure Income No.2/2b Ltd | Renewable Power | Wind Power Generation |
Beacon Rail Leasing S.à.r.l | Transport | |
Desert Sunlight | Renewable Power | |
Ennatuurlijk | Network Utilities | |
INNOVATTEL, LLC | Data Infrastructure | |
Projco (St. Andrews Hospital) Limited | Social Infrastructure | Health and Social Care Services |
Saubermacher Dienstleistungs AG | Diversified and Other (including Environmental Services) | |
Urbs ludex et Causidicus S.A. | Social Infrastructure | Education Services |
Entity is an Asset Sector Leader (leader for the Class)
Learn more about how we recognize leadership in the GRESB Assessments

Infrastructure Partners
Global
Premier
Partner
Infrastructure Industry Partners


