
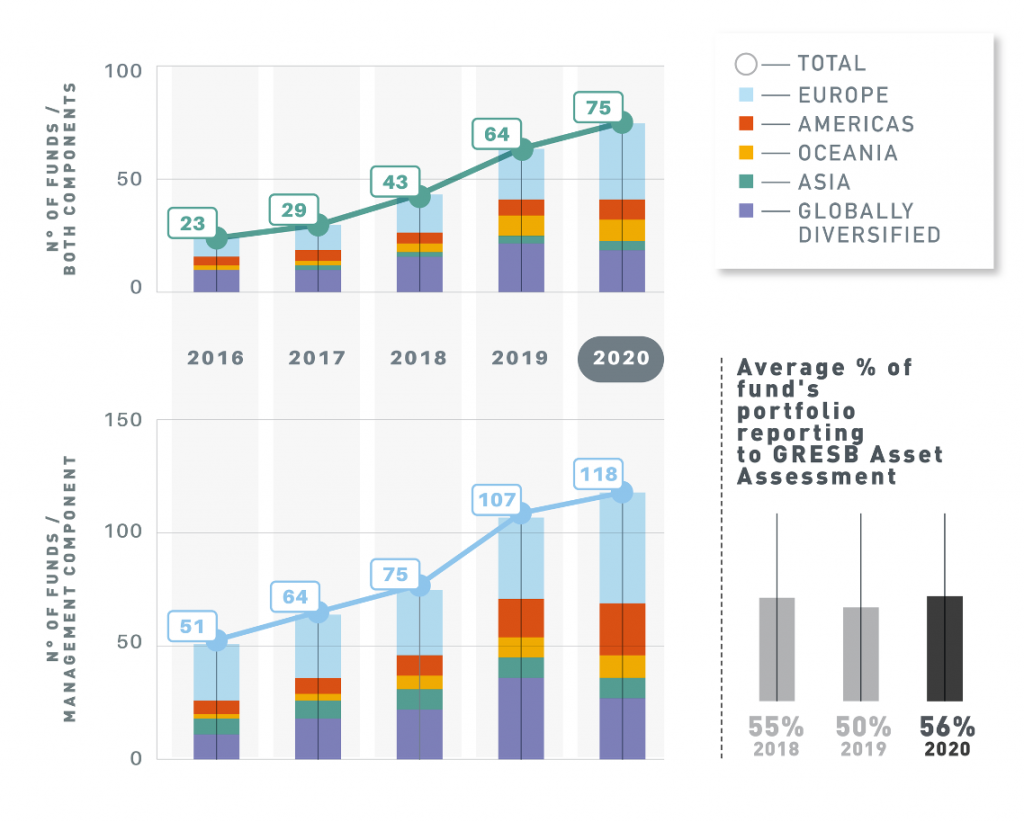
Fund Coverage and growth
Participation in the Fund Assessment up 10% in 2020
Despite the challenges posed by the Covid-19 crisis, the Infrastructure Fund Assessment grew to 75 funds completing both components – obtaining a GRESB Fund Score reflecting overall ESG performance at the portfolio level – and 118 completing the Management Component.
By region, Europe-focused funds are the largest contingent, followed by Globally Diversified.
The Assessment now covers 32% of IPE Real Assets’ Top 100 Infrastructure Investment Managers, and 38% of the Infrastructure Investor Top 50 – participating with at least one fund.
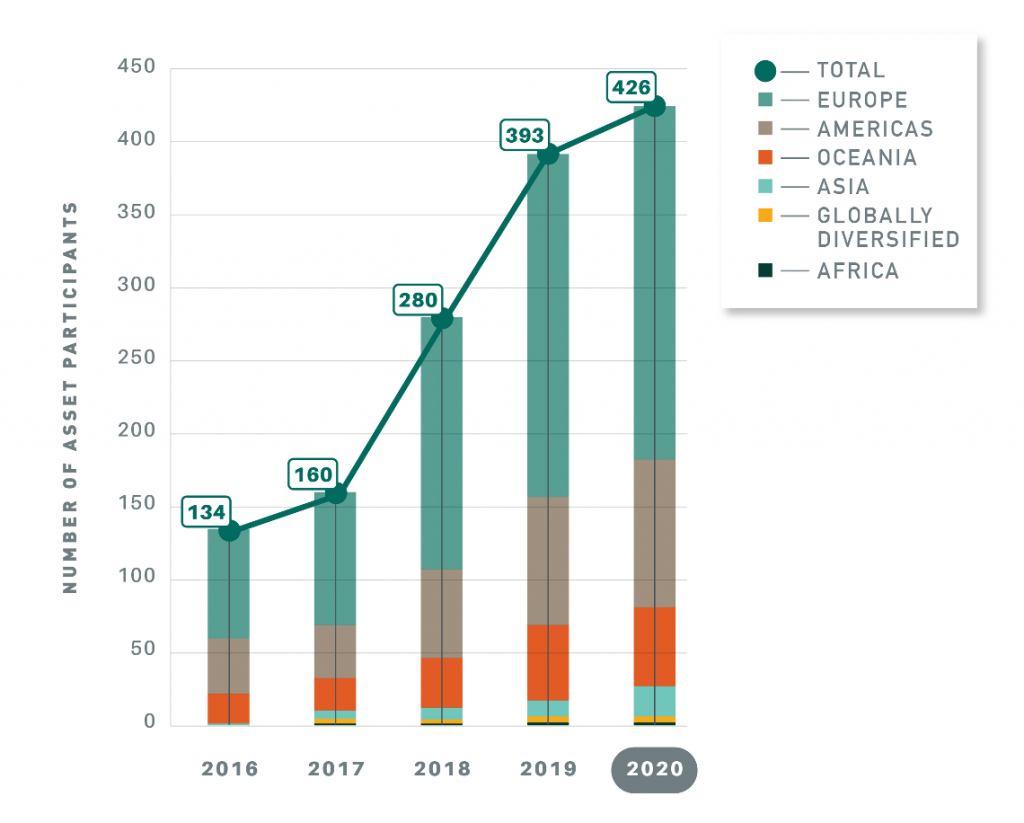
Asset Coverage and growth
Participation in the Asset Assessment grew 8% in 2020
The Infrastructure Asset Assessment increased by 8% to cover 426 assets.
Assets based in Europe still make up the largest proportion but the main growth regions were Americas (from 88 to 105) and Asia (from 11 to 21). The Assessment now covers 32 of the 33 industry sectors, and 1,354 facilities across 59 countries.
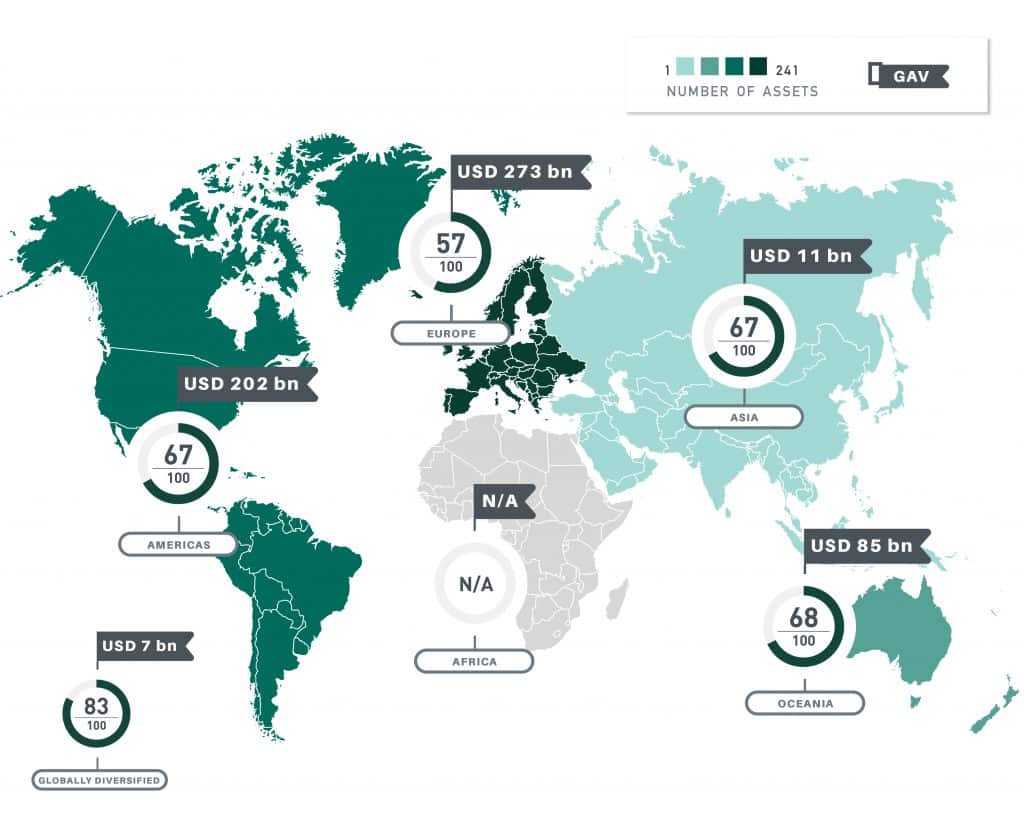
Regional Scores and GAV
Europe has the most funds and assets participating in the benchmark by value
Assets reported on six continents, with over 1,354 facilities (a 19% increase) spread across 59 countries, with coverage continuing to be dominated by OECD countries.
Europe builds upon its track record for transparency with the most funds and assets participating in the benchmark by value. Assets in Oceania, Americas and Asia scored similarly, while the European average was somewhat lower. This is likely due to the significant number of Social Infrastructure assets in Europe, which typically score lower than other sectors. Globally diversified assets scored highest on average, although the number of these is very small.
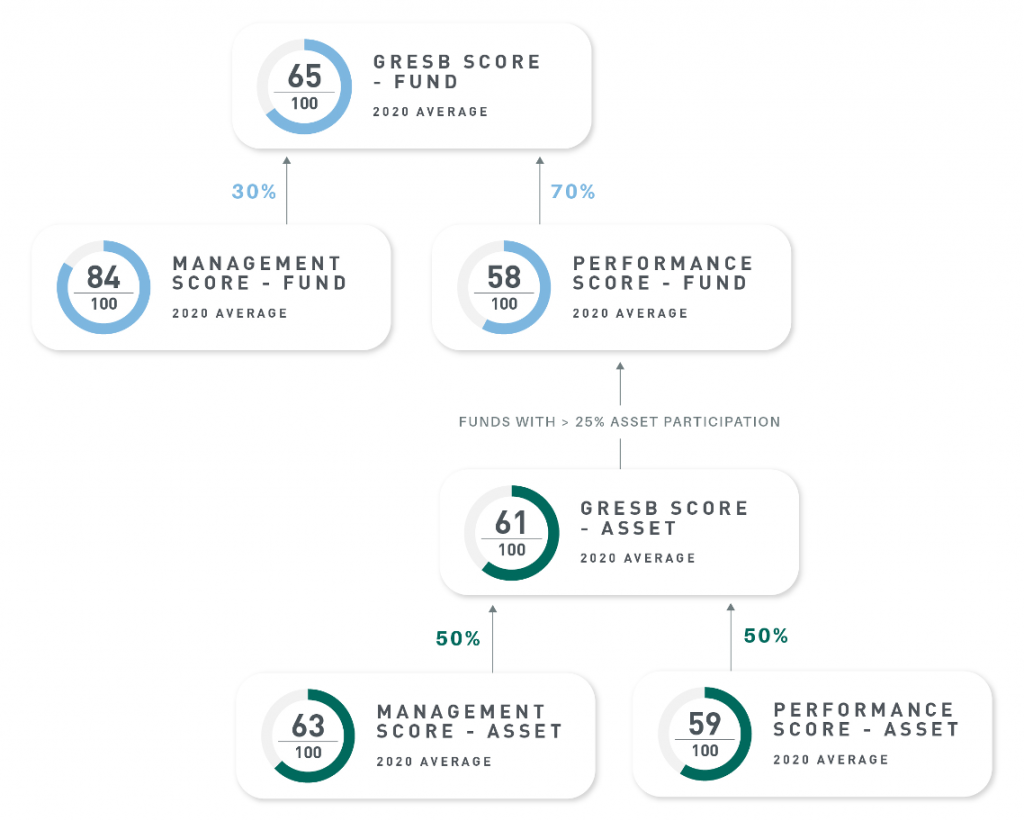
GRESB and Component Scores
Leap in scores for both Funds and Assets
The big news this year is the leap in scores for both Funds and Assets. Overall GRESB Scores and Component Scores, saw increases ranging from 10 to 15 points on average. At a fund-level, only two funds saw their scores decrease whilst thirteen managed to score the maximum 100 for the Management Component showing further improvement on last year.
In the case of Assets, for the first time in GRESB history (including Real Estate), one asset scored a maximum 100 for their overall GRESB Score. This shows that the industry is maturing in its approach to ESG and is strongly focused on improving performance.
Performance Component
Asset Performance Component indicators
-
The Asset Performance Component indicators show the extent to which assets report on their most material ESG issues. The chart focuses on the main ESG issues covered. The chart shows the proportion of participants that reported on each material indicator. Investor demand for greater reporting on these indicators has led to an increase in reporting for every issue except Health and Safety, which is stable compared to the previous year.

-
To drive performance improvement, it is good business practice to set targets and track performance. This chart shows the proportion of assets that set targets for the reporting year (2019). It is notable that target setting has increased for every ESG issue.

Resilience
-
97%, 93%, and 82% of 2020 Resilience Module Participants (Real Estate, Infrastructure Fund, and Infrastructure Asset, respectively) had assigned responsibility for climate risk and resilience of the entity to an employee and/or team.
The breakdown of where that responsibility lies within the organization, particularly between the “same individual” (green) and “different individual” (light blue), suggests that, in many cases, climate risk and resilience are deemed as a sustainability issue as opposed to their own risk management issues.

-
GRESB 2020 Resilience Module Participants reported systematic processes to assess their entities’ exposure to physical risk more often than for transition or social risk. Additionally, Real Estate Participants more often had systematic risk assessment processes in place than did Infrastructure Participants.

-
Of the 2020 Resilience Module participants, 85%, 75%, and 58% (Real Estate, Infrastructure Fund, and Infrastructure Asset, respectively) reported having a systematic process to incorporate climate risk and resilience into planning, budgeting, evaluation, and/or similar activities.
Real Estate participants demonstrated higher rates of integration across risk type and integration method as opposed to Infrastructure participants. Across integration method, well-defined climate-related risks are generally easier to incorporate than, often times less-quantifiable, social risks. Finally, work plans seemed to be the most systematically leveraged integration method of resilience issues.

-
Some examples of social risks captured by the 2020 Resilience Module include: crime rate, modern slavery, workplace health and safety, pandemics, physical security, cyber security, terrorism, demographic shifts, and even “social media risk”. The range of such responses highlights the difficulty of providing useful standardized and benchmarked data to asset managers and investors.
Other answers were drawn directly from the language of the TCFD, such as increased stakeholder concern or negative stakeholder feedback, or addressed environmental or governance issues such as air quality or site contamination. This further illuminates the fact that risks relating to social, climate-related, and other ESG-related issues are not mutually exclusive, and can often complement or compound each other.
Whether stemming from or ultimately affecting people, all ESG risks are related to humans in one manner or another, making the delineation of social risk in the context of a resilience assessment a formidable challenge.
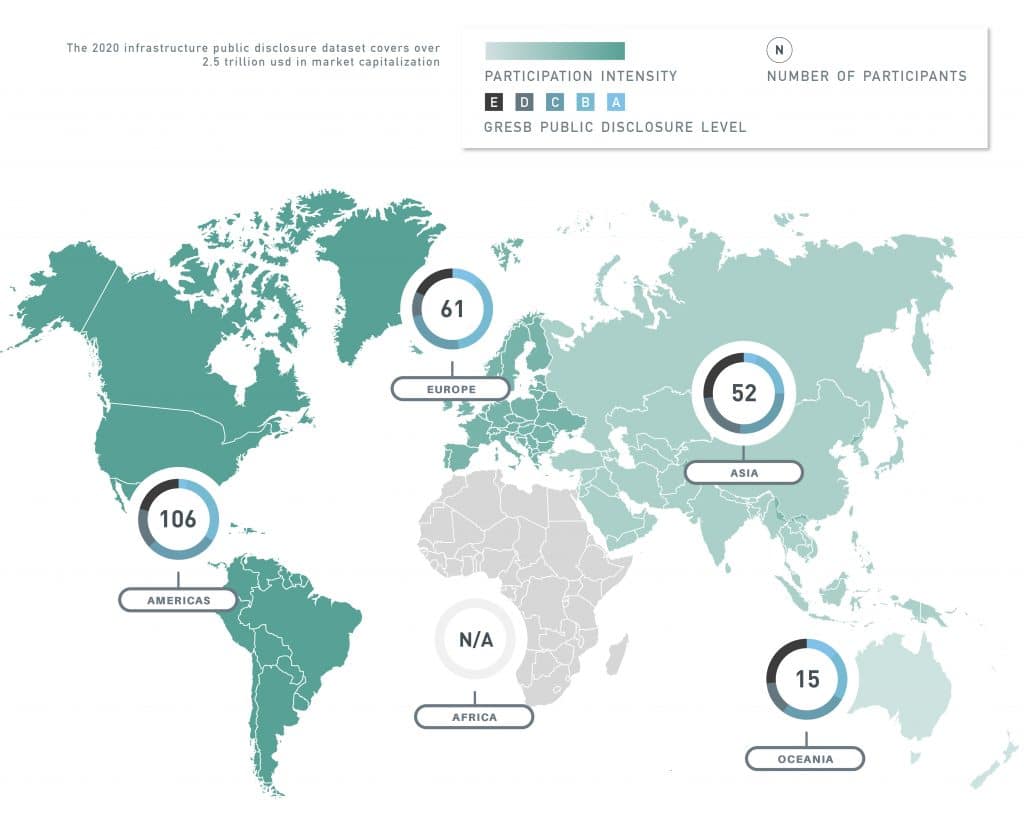
Public Disclosure
Similarly to 2019, overall Europe has the most number of companies who scored a level of A. Relative to sample size Oceania is in the lead with with about 13% of entities scoring an A.
The dataset now covers more than 200 listed infrastructure companies and more than USD $2.5 trillion in market cap.
The data is also being used for a new GLIO/GRESB INDEX – the first specialist global listed infrastructure ESG focused index for global investors.
Sector Leaders
-
Entity Name Superclass Class Amey Belfast School Partnership PFI Co Limited Social Infrastructure Education Services Bayonne Energy Center Power Generation x-Renewables Independent Power Producers BlackRock – Gestión Integral de Hospitales de Zumpango, S.A.P.I. de C.V. (“GIHZ”) Social Infrastructure Health and Social Care Services BUUK Infrastructure No 1 Limited Diversified Celeo Redes Brasil SA Network Utilities Crook Hill & Reaps Moss Renewable Power Wind Power Generation Glasgow Airport Limited Transport Airport Companies Globalvia Transport Road Companies ITS ConGlobal Transport MHL Supply Networks (Asia) Limited Other Oiltanking Singapore Chemical Storage Pte Ltd Energy and Water Resources OPALE DEFENSE Social Infrastructure Government Services Port of Brisbane Pty Ltd Transport Port Companies Saubermacher Dienstleistungs AG Environmental Services Sonnedix Power Holding Renewable Power Solar Power Generation South East Water Network Utilities Water and Sewerage Companies TDF Data Infrastructure Data Transmission UDICITE Social Infrastructure Education Services Ventient Energy Renewable Power Wind Power Generation -
Entity Name Fund Manager Name Sector | Region Alinda Infrastructure Fund II Alinda Capital Partners Region: Globally diversified Civis PFI/PPP Infrastructure Fund LP Dalmore Capital Limited Sector: Sector specific Macquarie Asia Infrastructure Fund 2 Macquarie Infrastructure and Real Assets Sector: Sectorally diversified Macquarie Asia Infrastructure Fund 2 Macquarie Infrastructure and Real Assets Region: Other region (Americas, Asia or Oceania) Macquarie European Infrastructure Fund 4 Macquarie Infrastructure and Real Assets Region: Europe