Global
Response Rate: Strong Growth in Participation | Funds
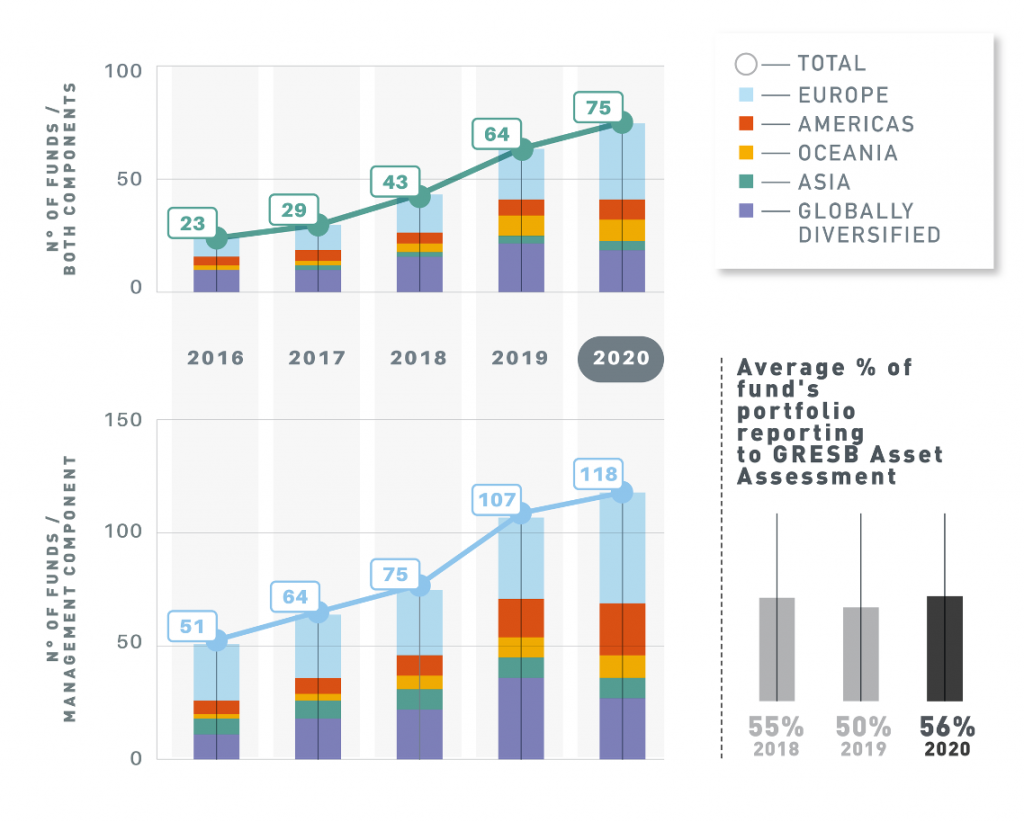
Fund participation grew 17% compared to last year. There was a 48% increase in funds obtaining a GRESB Fund Score (the ultimate measure of Fund ESG performance for investors).
It is also pleasing to see that the average proportion of assets participating across all funds has risen from 44 to 55%, heading towards that investor transparency goal.
Response Rate: Strong Growth in Participation | Assets
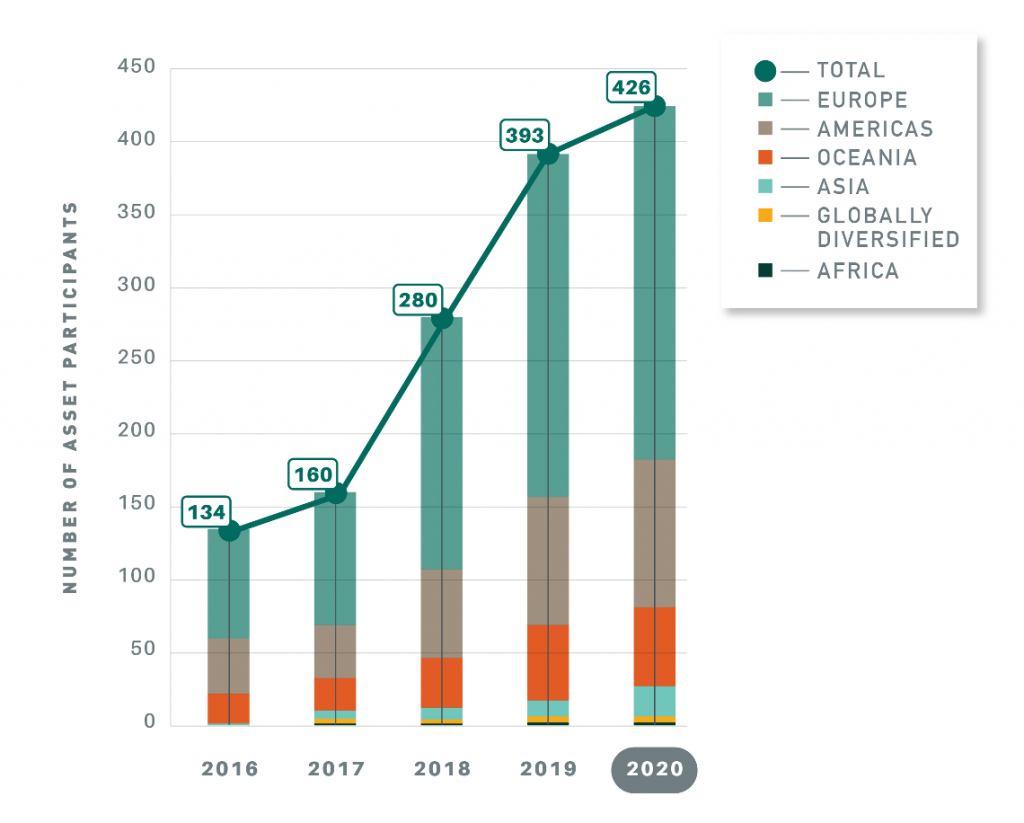
Now in its third year, participation in the infrastructure assessment has reached ‘critical mass’ with strong growth – a 75% increase compared to last year.
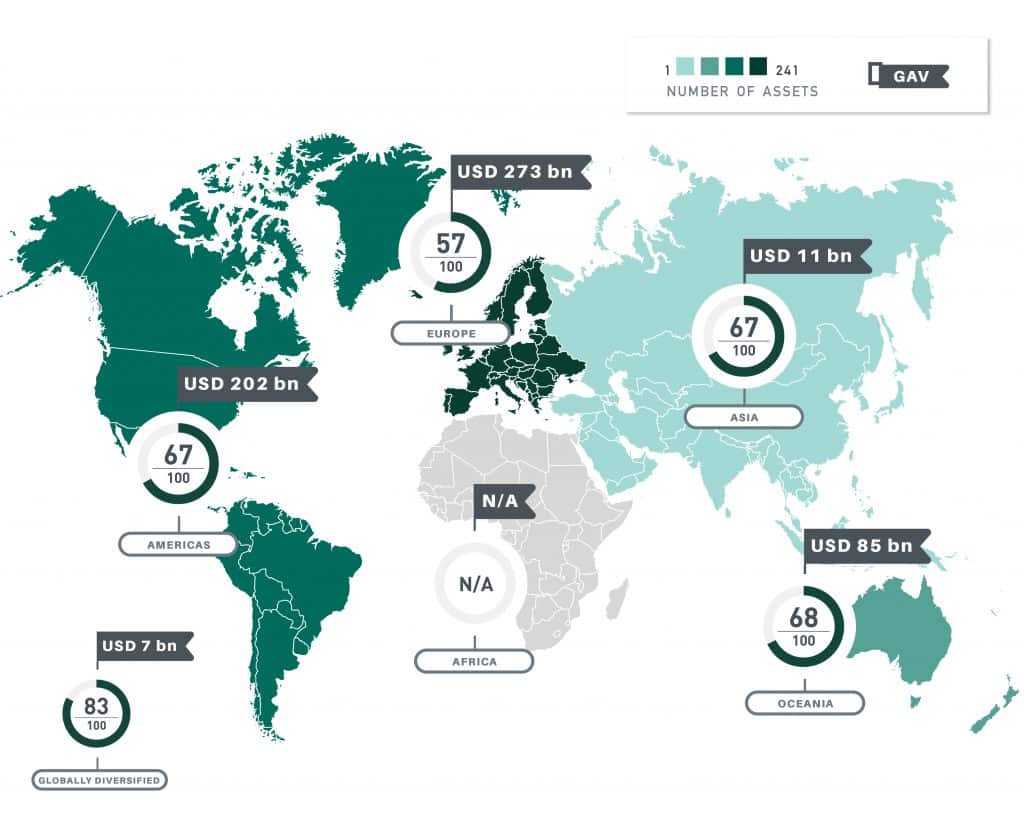
In terms of regions, participation grew across all regions with Europe growing the most, now making up just over half of participants by gross asset value (GAV), followed by North America (25%) and Australia/NZ (16%).
Regional GRESB Score and Coverage | Assets
Assets participating in the GRESB Infrastructure Assessment now span some 62 countries, being predominantly OECD nations. Average Asset scores tended to cluster together this year hovering around 60 for North America, Australia/NZ and globally diverse regions. Europe’s average was slightly lower as was South America’s.
Fund
Funds Improving their Sustainability Performance : GRESB Model
The GRESB Model for Funds shows the Fund score on the vertical axis and the Weighted Average Asset score on the horizontal axis. The average Fund Score increased from 60 to 69 this year, showing increased consideration of ESG within management and investment processes by Fund Managers. The average Weighted Asset Score increased from 43 to 49 with 43 of the 75 funds receiving a GRESB Fund Score.
The average GRESB Fund Score increased from 50 to 55, signalling not only improved performance but increased asset coverage and performance as well. Notably for these funds, the Fund score is almost always higher than the Weighted Asset Score, showing that fund management practices tend to lead the overall performance of the underlying assets. This suggests that Fund Managers should put most effort into improving asset performance before improving their own practices.
Funds improving in almost all areas
Looking more closely at the Fund Assessment and the performance on its 11 indicators, this chart shows the percent responding to each indicator. The first indicator, Fund 1 was new. Apart from that, fund indicator scores increased this year across all indicators except Policies. Almost all funds now have a senior decision-maker accountable for ESG issues. Third party review of ESG disclosure increased significantly and is now at 27%.
Most Funds Have Sustainable Investments Objectives
A new indicator was added to the Fund Assessment in 2018 focusing on sustainable investment objectives. 75% of funds reported having such objectives. They also reported on a range of different actions implemented to achieve these objectives.
The most common actions were Integration within business strategy (69%) and Review of investment policies (64%), while the least common were Adjusting risk materiality thresholds (21%) and Exiting from certain investments (25%).
Funds improved their disclosure, but not Assets
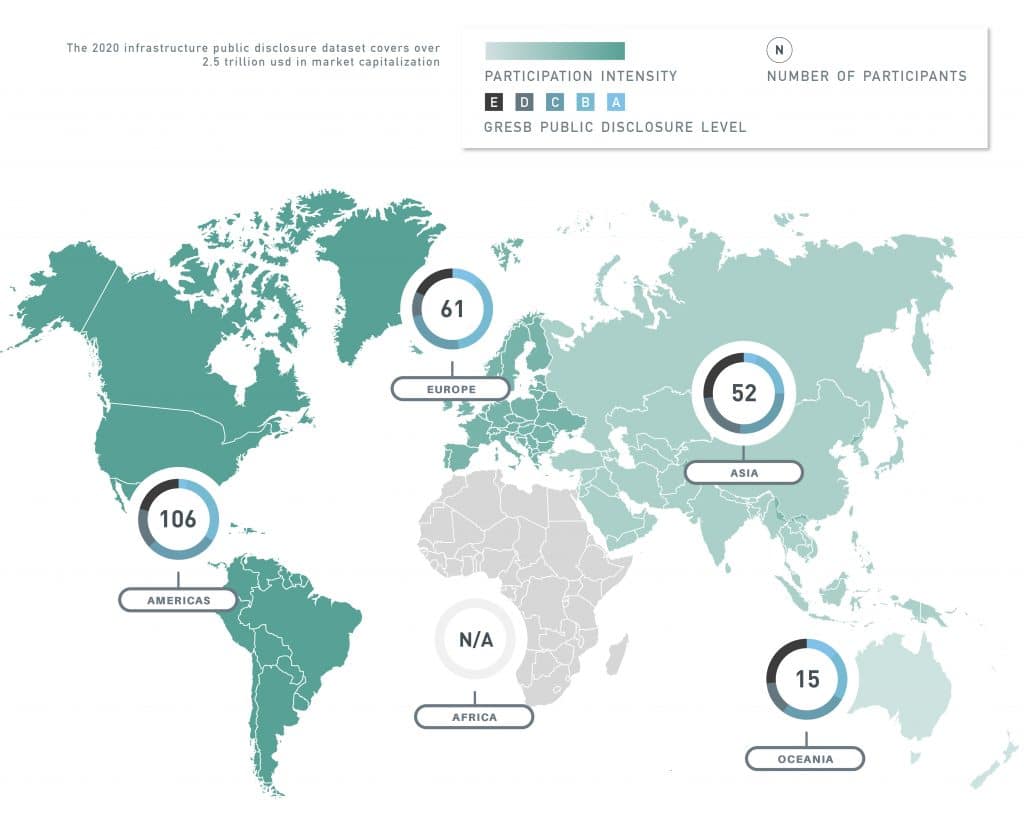
Infrastructure investors increasingly demand greater and greater ESG disclosure. This graph shows the percentage of funds (light blue) and assets (dark green) that disclose their ESG performance through various means. Funds tend to show a higher degree of ESG disclosure than assets across all disclosure strategies except for integrated reporting where the proportion is similar. Funds also improved their communication compared to last year while assets stayed much the same. In general, there is still room for improvement. And notably, integrated reporting remains relatively uncommon.
Asset
Asset performance continues to improve but could do better: GRESB Model | Asset
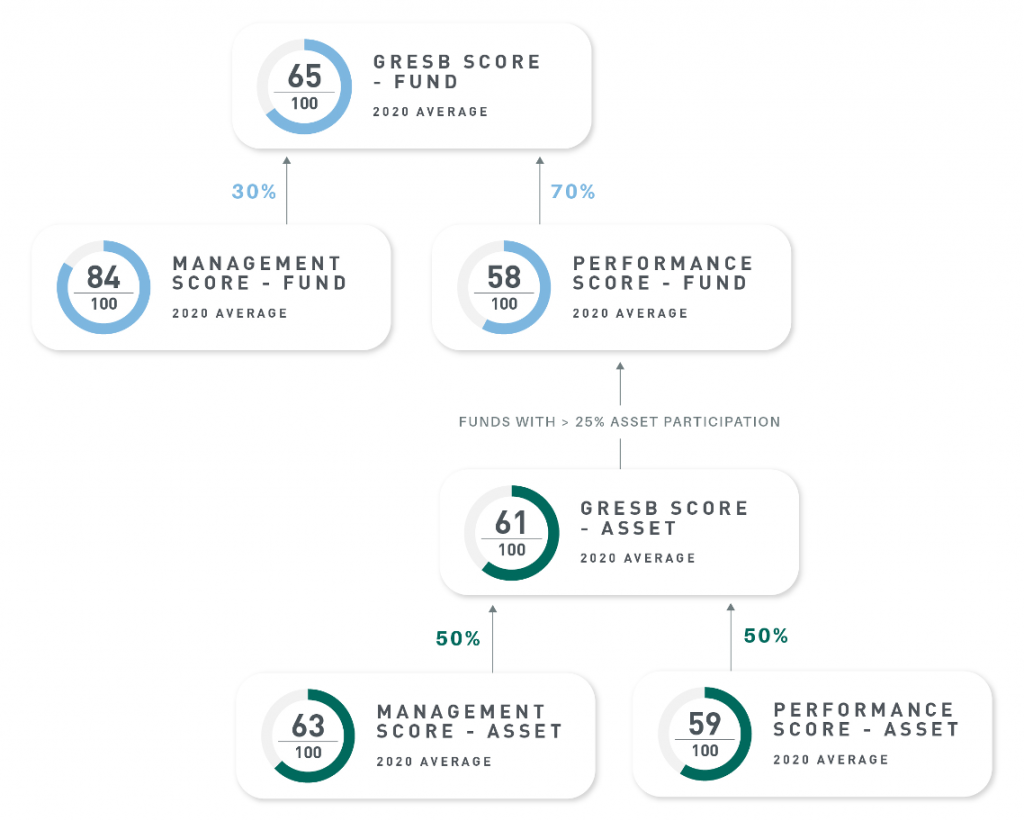
The GRESB Model for Assets splits the assessment scores into two components – the Management & Policy aspects and the Implementation & Measurement aspects. These each make up about 50% of the score. Overall ESG performance by reporting assets improved again from a total average of 43 to 48 in 2018 as shown by the total score.
Average scores for Implementation & Measurement improved significantly from 34 to 46 while Management & Policy actually decreased slightly from 52 to 49 showing that more emphasis may have been put on the implementation side in the last year.
GRESB Aspects
The assessment is divided into 7 aspects shown here. The shift in Management & Policy vs Implementation & Measurement shown in the GRESB Model is also reflected in these Aspects, with the more implementation oriented aspects like Stakeholder engagement and Performance indicator scores having increased, while Management, Policy & disclosure, and Monitoring & EMS aspect scores have decreased on average compared to last year.
While reporting on Performance indicators was a clear weakness last year, there appears to have been a ‘rebalancing’ of aspects this year. Likely partly due to changes in scoring approach (including materiality) and changes in participants responses.
Certifications continue to be uncommon for our infrastructure participants suggesting that since most of these are development stage focused, they may take some years to be reflected in operating assets.
Sector Scores “Re-Balanced”
Regarding sectors, we revised the sector classification slightly to better align with other infrastructure classification schemes. Participation grew across the board but was strongest in Social infrastructure, Renewable energy generation and Transport. Introducing materiality based scoring produced a fairer assessment and scoring, resulting in the average scores for the sectors crowding together, although the Social infrastructure sector continued to show lower scores in general.
GRESB helps set an improvement pathway
An influx of new participants (50% of assets this year are new), has had the effect of tempering the rise in average asset score. This graph shows the average historical scores for 2018 participants only. Those who started participating last year seemed to join in with similar scores to the first year participants. The new participants this year clearly show a lower score compared to the repeat participants, in fact this is very similar to the very first year average (2016) result.
We can see that Infrastructure assets that have been early adopters in reporting to GRESB invariably score better than new participants. This follows a similar experience in Real Estate.
Incentivized people drive better ESG performance
Indicator MA6 captures whether and how Asset companies include ESG factors in the annual performance targets of personnel.
We looked at this indicator carefully this year to see if there was any correlation between the strength of the consequences of achieving these targets, and the GRESB scores achieved, and indeed we found a strong correlation.
Scores are highest where there are both financial and non-financial consequences for achieving ESG targets, scores are somewhat lower when consequences are only financial, lower again when consequences are only non-financial, and lowest of all when there are no consequences at all.
Materiality approach stongly supported
In a very important improvement this year, we introduced materiality based scoring across many of the Asset Assessment indicators using standard sector materiality weightings, assigned to each entity based on their primary sector. This tailors the assessment to each asset’s sector so that participants were assessed on the ESG issues that are material to their sector.
This figure shows the response of participants to all issues that were either ‘Highly relevant, ‘Relevant’ or ‘Not relevant’ (the three materiality levels we applied). As might be expected, a high proportion of participants addressed ‘Highly relevant’ issues in their policies, risk assessment and the like. Around half of the participants addressed ‘Relevant’ issues. Whilst a lower proportion addressed ‘Not relevant’ issues, this was still around 25% suggesting that there might be some wasted effort that could be better spent on the most material issues.
Participants were also given the opportunity to review the materiality weightings, and nominate and justify different weightings if they disagreed with the standard sector weightings. In 92% of cases, participants agreed with the standard sector weightings showing strong support for materiality based scoring. The areas of disagreement focused around Child labour, Employee health & safety, Light pollution, Stakeholder relations, and Biodiversity & habitat.
This data will help to further redefine the materiality process in 2019 and beyond.
Reporting On ESG Performance Strongly Affected By New Participants
The Asset Performance Indicators look at whether and how assets report on their most material ESG issues. There are currently 7 Performance Indicators in the assessment as shown. Here we show historical trends of indicator reporting in the green circles, with 2016 being the innermost circle and 2018 the outermost. Interestingly, asset reporting on performance indicators did not improve, halting the trend seen last year.
This is primarily because half the asset participants were new as shown in the blue bar charts. In these charts, showing 2018 performance, the mid blue bar is repeat participants, the light blue bar is new participants and the black dot is the overall average. It is clear that new participants in general report less. Repeat participants however continued to improve their performance reporting.
Intensity: Towards standard performance metrics
Feedback from our investor members is that they desire more focus on performance indicators and we have responded – we standardized metrics for indicator reporting building a basis for comparable intensity metric reporting. Intensity metrics utilise a numerator (measure of impact) divided by a denominator (measure of asset size). The numerators are our main performance indicators (energy, GHG, water and waste).
The two most common and readily available denominators are Gross Asset Value and asset output. This figure shows our calculations regarding the capability of our participants to report on common intensity metrics. In each of these mini-figures, the top, light blue bar is the percentage reporting the numerator, for example, for Energy, this would be energy consumption in MWh. The second, green bar is the percentage reporting the denominator, being either an output metric such as Megalitres of water treated, the top series across, or GAV, the bottom series across. The third, grey bar is the overlap, that is the percentage that report both numerator and denominator and therefore can report the intensity metric.
Looking across the top and bottom series, you can see that about 30-55% of assets currently have the ability to report on GAV intensity and 20% on output intensity. We will work with the industry to further standardise reporting and provide guidance to ensure consistency and comparability.
Performance Targets: Room for Improvement
To drive performance improvement, it is good business practice to set targets and track performance against them. These figures provide a summary of how assets are setting targets for Energy and GHG emissions. The ‘race tracks’ show 1) what percentage of assets reported actual performance on the indicator, 2) the next line shows what percentage set targets for 2017, 3) the next line distinguishes where the targets set were legitimate (we removed targets that were identical to actual or unlikely zeros), and 4) the final line shows what percentage of assets actually achieved their target. The blue race tracks are for 2017 targets and the dark green are for long term targets.
Whilst over half of participants are measuring performance, only about 15-20% are setting legitimate targets and only 12% reported achieving the 2017 target, showing much room for improvement. On the other hand, participants as an overall average beat their 2017 Energy and GHG emissions targets by 1.2% and 1.7% respectively. The long term targets are set on average about 4 years into the future and for energy on average target a 9.1% annual reduction, while for GHG emissions they target a 1.4% annual increase. While the energy reduction targeted is impressive, the rise in GHG emissions targeted is a long way from anything like net zero emissions that might be required for a rapid transition to a low carbon economy as advocated by some.
First Data On Sector Carbon Intensities
For the first time, we have started to calculate ESG intensity metrics. The results should be treated with caution as more needs to be done to standardise reporting boundaries and assumptions. Nevertheless, these results show what the industry is capable of reporting and how we can start to compare sectors and assets in the future. We have focused for a start on Greenhouse Gas (GHG) emissions per unit of gross asset value (tCO2e/$), being a measure of Carbon Intensity. This chart shows the carbon intensities for 11 sectors for which we could obtain large enough sample sizes. These box and whisker plots show the minimum value, 1st quartile, median (circle), 3rd quartile and maximum moving upwards respectively. Note this graph is on a log scale.
Unsurprisingly Power Generation x-Renewables shows the highest intensity, an order of magnitude higher than the next highest. Electricity Transmission is next, followed by Energy Resources (energy pipelines, processing and storage). Most other sectors are in a similar range with Rail Companies somewhat lower but with a wide dispersion. This sort of information will no doubt become increasingly important for investors as the world transitions to a low carbon economy.
No correlation between asset size and ESG performance
It has been postulated that ‘ESG is easier for large entities’ because they can support the overhead of dedicated staff for this aspect. However we found no correlation between Gross Asset Value and GRESB Asset Score. Assets across 5 orders of magnitude in GAV achieved a very wide range of scores.
Asset Aspect Analysis – 2018 Monitoring and EMS, room for improvement
The above graph displays the average score of each aspect in the Asset Assessment per GRESB star rating. A clear dip can be found at the Monitoring and EMS level for three star participants and above and suggest a clear area for improvement in the systematic collection of data on ESG issues.
Sectoral
Sector Scores “Re-Balanced”
Regarding sectors, we revised the sector classification slightly to better align with other infrastructure classification schemes. Participation grew across the board but was strongest in Social infrastructure, Renewable energy generation and Transport. Introducing materiality based scoring produced a fairer assessment and scoring, resulting in the average scores for the sectors crowding together, although the Social infrastructure sector continued to show lower scores in general.
Sub-class Breakdown for Renewables, Transport and Social Sectors
Looking more deeply into some of the sectors, we have broken down the analysis for some sectors further into sub-classes. The highest scoring sectors at this level were airports, ports and road companies, with renewables close behind and the social sectors consistently lower.
Sectoral Model Asset
The GRESB Model splits the Asset Assessment scores into two components – the Management & Policy aspects and the Implementation & Measurement aspects. These each make up about 50% of the score. From a sectoral perspective, Energy Resources has the highest score (63), followed by Diversified Assets (61), the majority of the other sectors then cluster together with the exception of Social Infrastructure which has a far lower average score. This is primarily because this sector had the highest proportion of new participants, which tend to have lower scores.
Regional
Regional Model Fund
Dissecting the fund scores by region shows that Globally Diversified funds seem to perform the best with an average of 62. This is followed closely by the Australia/NZ, Europe and North America regions with a larger gap back to Asian funds (albeit there were only two funds in this region).
Regional Model Asset
The GRESB Model splits the Asset Assessment scores into two components – the Management & Policy aspects and the Implementation & Measurement aspects. These each make up about 50% of the score. The above GRESB Model results for all assets are colour coded by region. Assets with a global focus scored the highest on average (60) and are represented by the brown circles. While a wide distribution of scores is evident in nearly all regions, European participants make up a large proportion of the lower performing assets, which contributed to their lower average score (43). European participants also had the largest number of new participants (92% increase), which partially explains this lower average score.
Resilience
Special Report: Resilience & Real Assets
The report draws on the results of the 2018 Resilience Module and showcases the actions taken by leading funds and companies to address the resilience challenge. It also identifies important areas for improvement, providing ten actionable recommendations for investors and real asset companies working to navigate evolving expectations for the management of climate risk and resilience.
Resilience Sponsors
Resilience Partners
Resilience Module Indicator Responses
37 of the 280 Asset participants completed both the core Infrastructure Assessment and the Resilience Module. Responses for eight new indicators in the 2018 GRESB Resilience Module are summarized in this section.
The new results provide a unique picture of how infrastructure companies and funds from around the world are beginning to address resilience. Over 80% of respondents report designating an internal leader and establishing clear lines of communication and accountability through cross-department teams or working groups. More than 60% of respondents report identifying and engaging stakeholder groups and taking action to reduce risks during new construction and operations. Less than half of infrastructure respondents report systematically tracking the impact of extreme events and near misses.
Resilience-related responses by market segments
Resilience-related responses by market segment. Each bar represents 25% of respondents. The y-axis indicates the relative number of indicators reported by each company in the segment with higher scores reflecting more comprehensive responses. Given 37 infrastructure participants in the Resilience Module, there are 9 or 10 respondents per segment.
Responses to individual resilience-related indicators is interesting and important. However, the elements of leadership, risk assessment, business strategy, and performance measurement need to be used together to promote resilience. The conjoint analysis of these factors is reflected a measure of comprehensiveness of the response of each company. The breadth of responses is not necessarily an indicator of quality or risk management; however, it is likely to be indicative of the comprehensiveness of an organization’s approach to resilience. Participants were segmented to examine differences in responses between four market segments. On average, infrastructure participants in the top 25% of participants provided responses for 74% of answer choices, while participants in the bottom 25% provided information for 12% of answer options.
Global Partners
GLIO strongly supports GRESB’s work in infrastructure and is determined to build an even closer working relationship over the coming years. In particular, we believe that listed infrastructure companies have an asset class leading role to play in ESG disclosure and transparency. The work of GLIO and GRESB will help communicate this critical message to global investors.
Fraser Hughes, CEO, GLIO
The continuing development of GRESB’s infrastructure dataset is fostering transparency of ESG performance, enabling greater efficiency in the marketplace.
François Bergère, Executive Director, Long-Term Infrastructure Investors Association (LTIIA)
Sector Leaders
The GRESB Sector Leader program recognizes the best performers annually from across the GRESB Assessments. Achieving sector leader status is clear recognition of best practice ESG performance by funds and assets. We congratulate our 2018 sector leaders.
Infrastructure Fund Sector Leaders
Region | Sector | Name |
---|---|
Region: Europe | Arcus European Infrastructure Fund 1 , Arcus Infrastructure Partners |
Region: Globally diversified | Archmore International Infrastructure Fund I, UBS Asset Management |
Region: Other (Africa, Asia, North America, Oceania and South America) | AMP Capital Diversified Infrastructure Trust, AMP Capital |
Sector: Renewable Power Generation | Asper Renewable Power Partners 2 Fund (RPP2 Fund), Asper Invesment Management |
Sector: Diversified | Archmore International Infrastructure Fund I, UBS Asset Management |
Sector: Other (including Data infrastructure, Social and Transport) | Macquarie Super Core Infrastructure Fund, Macquarie Infrastructure and Real Assets |
Infrastructure Fund Sector Leader Categories
Infrastructure Fund Sector Leaders have achieved the highest overall GRESB Fund score*, which is a combination of the Fund Score and the Weighted Asset Score, within each of the following categories:
- Sector: Diversified, Energy generation – Renewable, Other (including Telecom, Social and Transport)
- Geography: Europe, Globally diversified, Other (Africa, Asia, North America, Oceania and South America)
*Each category must have at least 6 entities
*Each fund must be included in at least one category
Infrastructure Asset Sector Leaders
Sector | Name |
---|---|
Transport - Airport Companies | Adelaide Airport Ltd, Adelaide Airport Ltd |
Transport - Rail Companies | Alpha Trains (Luxembourg) Holdings S.Ã r.l., Alpha Trains (Luxembourg) Holdings S.à r.l. |
Transport - Ports | Associated British Ports, Hermes GPE LLP |
Social Infrastructure | HELIOS, Mirova |
Energy Resources (Energy Pipeline, Resource Processing and Resource Storage Companies) | Lochard Energy (Iona Operations) Trust, Lochard Energy |
Diversified | Ørsted A/S, Ørsted A/S |
Network Utilities (Electricity Transmission and Distribution, District Cooling/Heating, and Water & Sewerage Companies) | PowerCo Limited, PowerCo Limited |
Other Sectors | Saubermacher Dienstleistungs AG, UBS Asset Management |
Renewable Power Generation - Solar | Sonnedix Power Holding, J.P. Morgan |
Power Generation x-Renewables | Southwest Generation Parentco, LLC, J.P. Morgan |
Data Infrastructure (Telecommunications and Data Storage) | Towercom, AMP Capital |
Transport | Transurban Limited, Transurban |
Transport - Road Companies | Transurban Limited, Transurban |
Social Infrastructure - Education Services | UDICITE, Mirova |
Renewable Power Generation | Ventient Energy Ltd, J.P. Morgan |
Renewable Power Generation - Wind | Ventient Energy Ltd, J.P. Morgan |
Infrastructure Asset Sector Leader Categories
Infrastructure Asset Sector Leaders have achieved the highest overall GRESB score** within the following Asset Sectors:
- Data Infrastructure
- Diversified
- Energy Resources
- Network Utilities
- Power Generation x-Renewables
- Renewable Power Generation
- Social Infrastructure
- Transport
- Other (Including Environmental Services)
- Renewable Power Generation | Solar Power Generation
- Renewable Power Generation | Wind Power Generation
- Social Infrastructure | Education Services
- Social Infrastructure | Health and Social Care Services
- Transport | Airport Companies
- Transport | Ports
- Transport | Rail Companies
- Transport | Road Companies
**Each sector must have at least 6 entities